
The best leadership learning KPIs follow the path from learning to results: participation and completion, then skill and confidence, then behavior on the job, then business indicators such as retention and engagement. Pick a few at each step, set a target for each before the program starts, and collect data at baseline, after the program, and again months later. This guide shows how to do that, with example KPIs, a worked KPI statement, and the traps that make leadership data misleading.
TL;DR
- A leadership learning KPI is an outcome-oriented metric with a desired result and a specific target, defined before the program begins.
- Measure on four levels: reaction and participation, learning, on-the-job behavior, and business impact. Most teams stop at the first.
- Behavior change is the KPI that matters most. Capture it with 360-degree feedback and manager observation at baseline, after the program, and several months later.
- Link business indicators like retention and engagement to the program, but never claim training alone caused them.
- Start with five to eight KPIs, not thirty. A small set you actually review beats a dashboard nobody opens.
Table of Contents
- What a leadership learning KPI is
- The four levels of leadership learning KPIs
- How to write a KPI that can actually be measured
- Choosing a small set of KPIs
- Tracking results over time
- Connecting KPIs to business outcomes without overclaiming
- Where the 70-20-10 rule fits
- Perspective: count the habits, not just the hours
- Collecting this data with Leaderly AI
- Common mistakes to avoid
- FAQ
- Sources
What a leadership learning KPI is
A leadership learning KPI is a quantifiable measure of whether a development effort is producing the result you wanted. The U.S. Office of Personnel Management (OPM) describes metrics for leadership development as outcome-oriented measures that state a desired result and a specific target, and says they should be set before evaluation begins so you know which activities worked.
That definition rules out a lot of what gets reported. "Number of modules launched" is an activity count. "Participants rated the session 4.6 out of 5" is a reaction. Both are useful inputs, but neither says whether anyone leads differently on Monday morning.
It also helps to separate three terms that get blurred. Researchers Hastings and Rosch (2025) note that assessment, evaluation, and research are distinct: assessment collects indicators of outcomes, evaluation judges that data to drive improvement, and research asks broader questions. Your KPIs belong to assessment. What you do with them in a quarterly review is evaluation.

The four levels of leadership learning KPIs
The OPM guide organizes evaluation into levels. Level 3 measures whether participants apply new knowledge and skills to their work, and Level 4 assesses the effect on organizational business performance. Levels 1 and 2, reaction and learning, come before them. Together they give you a ladder you can climb one rung at a time.
| Level | What it answers | Example KPIs | Typical source |
|---|---|---|---|
| 1. Reaction and participation | Did people show up and find it relevant? | Enrollment rate, weekly active learners, completion rate, relevance rating | Platform data, short surveys |
| 2. Learning | Did they gain knowledge, skill, or confidence? | Pre/post assessment gain, self-rated confidence, simulation scores | Assessments, quizzes, scenarios |
| 3. Behavior | Are they leading differently? | 360-degree feedback change, manager-observed behaviors, practice streaks | Direct reports, bosses, peers |
| 4. Business results | Did team and organization indicators move? | Retention of direct reports, engagement scores, internal promotion rate | HRIS, engagement surveys |
Level 1: participation and engagement KPIs
These are the easiest numbers to get and the easiest to misread. Track them because they are leading indicators: if only a quarter of invited leaders open the content, nothing downstream will move.
- Activation rate: share of invited people who start within the first two weeks.
- Active learner rate: share who engage weekly or monthly, depending on your cadence.
- Completion of learning journeys: useful, but read it next to the active rate, since a short microlesson is far easier to finish than a two-day workshop.
- Relevance score: one question, "How useful was this for your current role?", beats a long satisfaction survey.
For a closer look at which usage numbers are worth the dashboard space, see our breakdown of leadership training analytics.
Level 2: learning and confidence KPIs
Use a baseline and a follow-up on the same instrument. Good options include a short knowledge check tied to the skills you are teaching, a self-assessment such as a style or emotional intelligence inventory taken before and after, and scenario-based simulations scored against a rubric. Report the change, not the final score. A cohort that starts high and gains a little can be a better result than one that starts low and gains a little more.
Level 3: behavior KPIs
This is where most programs earn or lose credibility. Observable behavior can be assessed through manager observations, employee feedback, and workplace evidence. OPM adds that application can be assessed through surveys or interviews with participants' bosses or direct reports, including 360-degree feedback before and after, with Level 3 data typically collected several months after the program.
Practical behavior KPIs:
- Change in 360 ratings on the two or three competencies the program targets (for example, giving feedback or delegating).
- Frequency of target behaviors reported by direct reports, such as holding a regular one-on-one.
- Practice consistency: how often a leader completes a habit exercise, a useful bridge between Level 1 and Level 3. Our guide to behavioral science in employee development explains why small repeated actions are the unit worth counting.
- Free-text themes. Qualitative responses give nuance about how participants applied learning and surface unexpected outcomes like increased confidence that numbers miss. Code them into a handful of themes and count the themes.
Level 4: business indicators
Training Industry lists retention, manager effectiveness, customer satisfaction, quality, sales performance, time to productivity, internal promotion, and engagement as relevant business-level metrics. For leadership specifically, the most defensible are the ones a leader directly influences:
- Retention of direct reports: turnover on a leader's team compared with the organization overall.
- Engagement score on the leader's team: from your existing pulse or annual survey.
- Internal promotion and bench strength: how many people in the program move into larger roles, and how many roles have a ready successor.
- Time to productivity for new hires reporting to program participants.
OPM cautions that gathering Level 4 data is a complex process involving managers and stakeholders, working within existing reporting systems. So borrow numbers HR already reports instead of creating new ones. Our piece on leadership training ROI metrics goes deeper on the financial side.
How to write a KPI that can actually be measured
A measurable KPI has a desired result and a specific target. The evaluation plan around it should specify what data will be collected, who will provide it, and how and when. A reliable template covers six parts:
- Metric: what is counted.
- Population: who is included (program participants, their direct reports).
- Baseline: the starting value, measured before the program.
- Target: the result you want and the time frame.
- Data source and owner: where the number comes from and who pulls it.
- Collection schedule: when it is gathered.
Here is one worked example, with illustrative numbers of our own, not a benchmark:
Metric: average direct-report rating on "gives useful feedback" (1 to 5, 360 survey). Population: the 40 first-time managers in the spring cohort and their direct reports. Baseline: collected in the first week of the program. Target: a gain of at least 0.4 points by six months after the program ends. Source and owner: 360 survey, run by HR business partner. Schedule: baseline, end of program, six months later.
Notice what makes it work. Anyone could look at the result and say plainly whether you hit it. If the target was missed, you also know where to look: the program content, the habit practice, or whether managers had the chance to apply it.
Choosing a small set of KPIs
There is no universal list. Hastings and Rosch (2025) state that no single right method exists for assessing leadership development outcomes and that plans should be matched to program outcomes. So start from the outcome, not from a menu.
- Name the capability gap. "New managers avoid hard conversations" is a gap. "Improve leadership" is not.
- Write two or three program outcomes that close the gap.
- Choose one or two KPIs per level that show progress toward those outcomes, for a total of five to eight.
- Set targets and a baseline before anyone logs in.
- Assign an owner and a review date for each KPI.
If you serve a college or university, outcomes often sit in a curriculum and the KPIs may look different, such as cohort retention in a leadership certificate or employer feedback on student projects. Our cohort blueprint for higher ed leadership development shows one structure, and leadership curriculum examples from other education-focused programs can help you see how learning outcomes are phrased before you attach metrics to them.
Tracking results over time
A one-time survey after training tells you how people felt that afternoon. Geerts (2024) recommends collecting quantitative and qualitative data from multiple raters at baseline, post, and post-post. In practice that is a cadence like this:
| Point | What to collect |
|---|---|
| Baseline (before launch) | 360 ratings, self-assessment, current retention and engagement for participants' teams |
| During the program | Activity and practice data, short relevance checks, monthly pulse |
| Post (end of program) | Repeat assessment, confidence, manager observations |
| Post-post (about six months later) | Repeat 360, free-text examples of applied learning, team indicators |
The same source says a formal evaluation framework should include ROI and consider control groups to justify investments to stakeholders. A control group does not need to be elaborate. Staggering enrollment so that the second wave serves as a comparison for the first is often enough for a mid-sized organization.
Connecting KPIs to business outcomes without overclaiming
Leaders will be asked, "Did the program cause the drop in turnover?" Be careful with the honest answer. A defensible story shows that a capability gap was identified, learning was delivered, behaviors were applied and verified, and related business indicators moved in the desired direction, without claiming training alone caused the result. The same source argues that business indicators should be chosen in advance, and that not every program needs a complex ROI calculation.
A few habits keep the story credible:
- Compare participants' teams with similar teams that were not yet enrolled.
- Report ranges and caveats, such as a hiring freeze or reorganization that also affected the numbers.
- Pair every number with a leader's example from the free-text data.
- Show the chain, not just the end: participation, practice, behavior change, team result.
There is also a reason programs underperform that no KPI will fix: broad rollouts often reach managers only, skip everyone else, and lack follow-through. We cover this in why leadership training fails at scale.
Where the 70-20-10 rule fits

The 70-20-10 rule says roughly 70% of development comes from on-the-job experience, 20% from other people, and 10% from formal instruction. Treat it as a rule of thumb for designing a program, not as a measured formula to hold yourself to. For KPIs, its useful implication is this: if most growth happens at work, your measures must reach the work. Course completion only covers the smallest slice.
That suggests adding KPIs for the other 90%:
- Experience: share of participants who completed a stretch assignment or practiced a target behavior in real work, tracked through short check-ins.
- Relationships: share who received feedback or coaching from a manager or peer during the program, which 360 surveys and pulse questions can capture.
- Formal learning: the Level 1 and 2 metrics above.
Perspective: count the habits, not just the hours
Here is what we see at Leaderly. Most leadership dashboards are heavy on hours and light on habits. Hours are easy to export, so they win. But a leader who spends three hours in a workshop and never changes a meeting is not developing, and a leader who spends four minutes a day practicing one behavior for eight weeks often is.
That is why we build around short microlessons, behavioral exercises, and built-in assessments rather than long courses, and why we think the most useful KPI most organizations are missing is practice consistency, tied to a 360-style measure of the same behavior. It sits between participation and business results, and it is the part you can influence while the program is still running. We also think measurement should cover every employee who leads, formally or not, not only the people with manager titles. Emerging leaders are where the largest gaps, and the largest gains, tend to be.
— Drew
Collecting this data with Leaderly AI
If you would rather not stitch together surveys, spreadsheets, and an LMS export, Leaderly AI is a mobile-first platform that combines personalized microlessons, habit-building exercises, self-assessments including DiSC, EQ, and MBTI, surveys, simulations, and analytics dashboards in one place. HR teams can see engagement and practice data by cohort and tailor learning journeys to the outcomes they defined. Universities can start from Leaderly AI for Higher Education and nonprofits from Leaderly AI for Nonprofits.
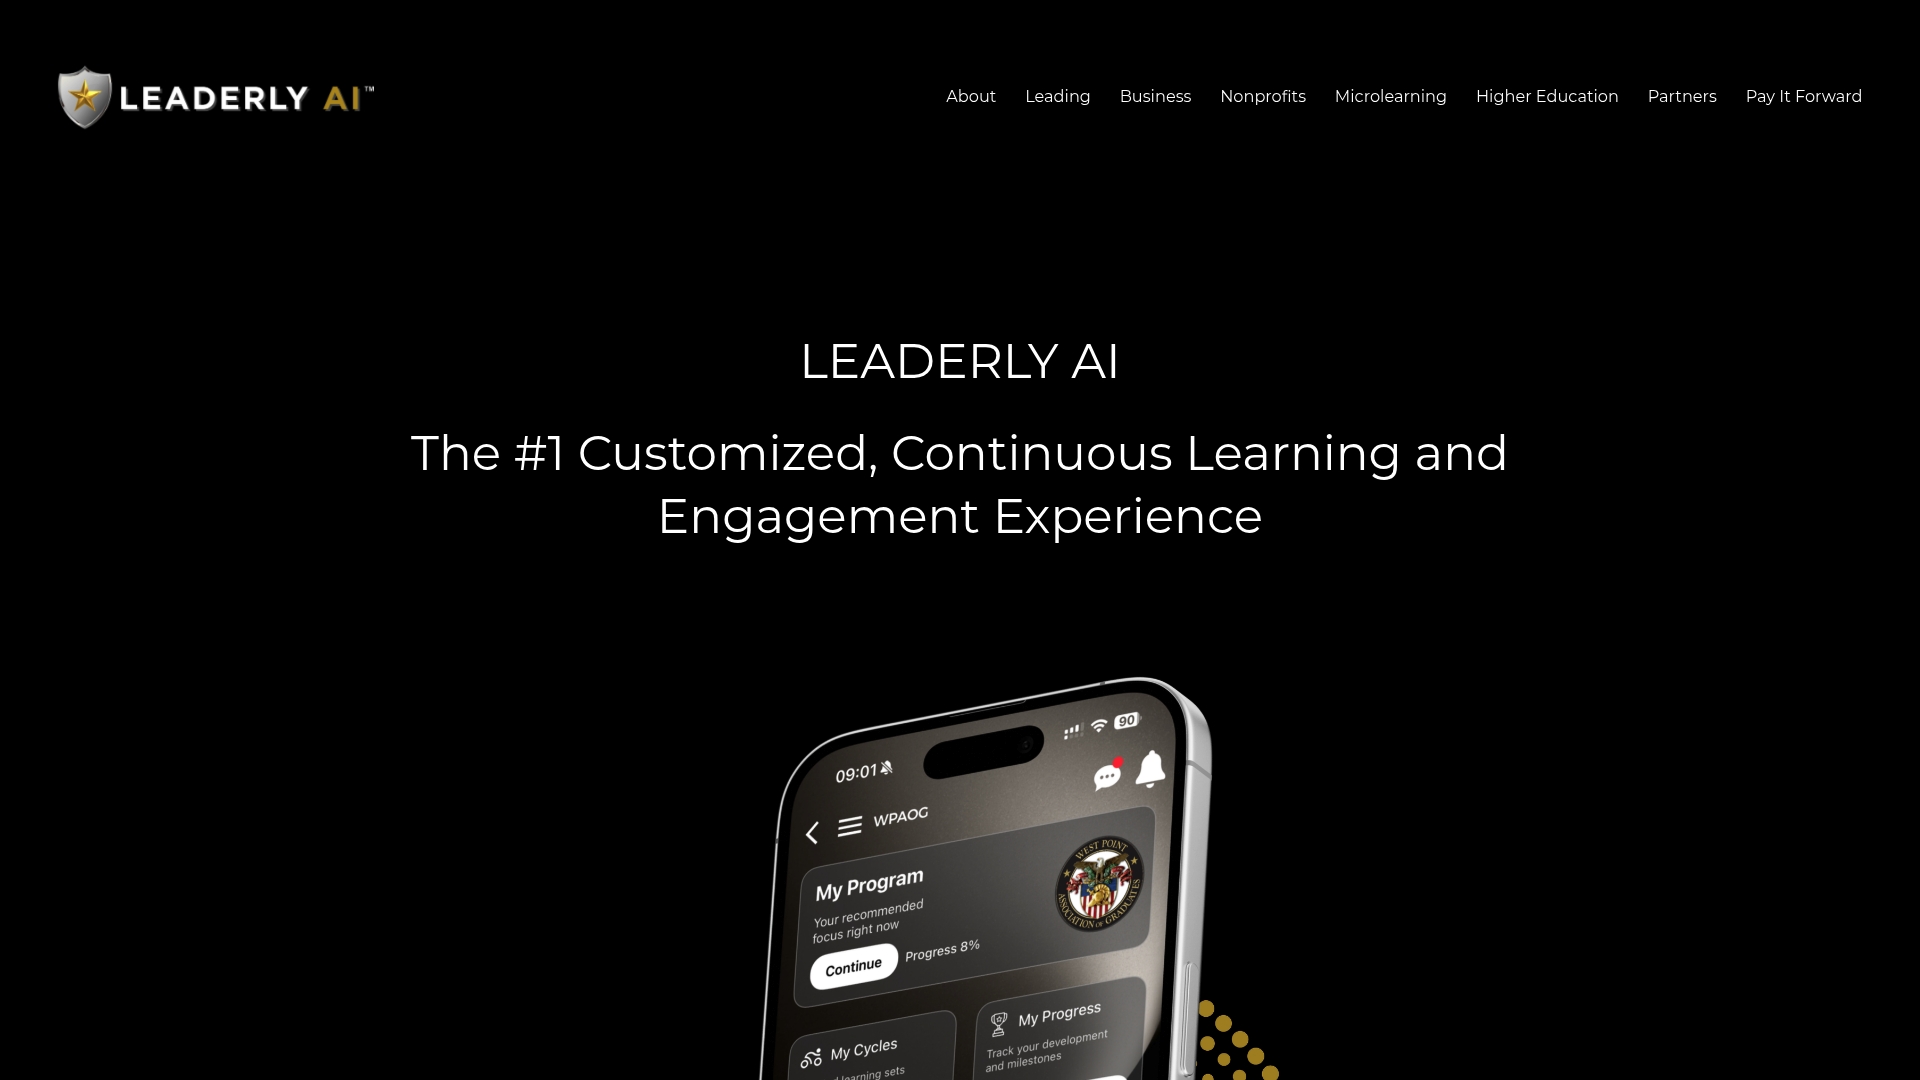
You still bring the outcomes and the targets; the platform makes the Level 1 to 3 data easy to gather and review. For a related look at the individual side, read how to track employee leadership growth metrics.
Common mistakes to avoid
- Starting with the dashboard. Choose outcomes first, then the numbers. Otherwise you measure what the software happens to export.
- Setting targets after seeing results. OPM's guidance is to decide metrics beforehand. Targets fixed afterward are just descriptions.
- Relying on self-ratings alone. People rate themselves more kindly than their teams do. Add direct-report or manager input.
- Measuring too soon. Behavior takes weeks to settle. Collect Level 3 data months after the program, not the same week.
- Reporting averages only. Look at who participated, who stopped, and which teams moved. An average can hide a cohort that never engaged.
- Ignoring qualitative evidence. A leader's story about a difficult conversation that went well is evidence, especially when it matches the 360 data.
FAQ
What are good KPIs for leadership development?
A balanced set covers four areas: participation (active learner rate), learning (pre/post assessment change), behavior (360 rating change on targeted competencies), and business results (retention and engagement on participants' teams). Pick one or two per area and set a target for each before launch.
How many leadership KPIs should we track?
Five to eight is a workable range for most programs. Each one should have an owner, a baseline, and a review date. If a KPI will not change a decision, drop it.
How long until leadership training shows results?
Participation and learning data show up within weeks. Behavior change takes longer, which is why OPM notes that Level 3 data are typically collected several months after the program. Business indicators like retention can take longer still.
Do we need to calculate ROI?
Not always. Training Industry argues that not every program needs a complex ROI calculation, as long as you identify business indicators in advance. Larger investments, or ones that must be justified to executives, deserve a fuller ROI analysis with a comparison group.
Sources
- Evaluating Leadership Development Programs, U.S. Office of Personnel Management
- Measuring Leadership Development: A 3-Level Approach, Training Industry
- Maximizing the Impact and ROI of Leadership Development, Geerts (2024)
- Framing Metrics, Outcomes, and Assessment Overview, Hastings and Rosch (2025)