
The most reliable way to track employee leadership growth metrics is to measure behavioral change, not training activity. Counting course completions tells you who showed up. Measuring whether a manager's team engagement improved three months later tells you whether leadership actually developed.
Before diving into frameworks and tools, here are the core metrics HR and organizational leaders should monitor:
- Employee engagement scores of direct reports (a proxy for leadership effectiveness)
- 360-degree feedback results from peers, subordinates, and supervisors
- Retention rates among teams led by program participants
- Internal mobility and promotion rates for leaders in development
- Skill acquisition progress tracked against defined competency benchmarks
- Promotion readiness ratings from structured succession assessments
- Team performance indicators such as productivity, quality output, and goal completion
Two frameworks anchor most serious measurement efforts in the U.S.: the Kirkpatrick Model, which evaluates development across four levels from learner reaction to business results, and the
, which distributes leadership growth across on-the-job experience, social learning, and formal training. Both are covered in depth below.Table of Contents
- How to track employee leadership growth metrics that reveal real development
- How the 70-20-10 rule shapes what you measure
- What the Kirkpatrick Model tells you at each evaluation level
- Connecting leadership metrics to business outcomes
- How Leaderly AI supports continuous leadership development tracking
- What real leadership growth tracking looks like in practice
- How to tailor leadership metrics to different organizational levels
- Key Takeaways
- Leaderlyapp makes continuous leadership measurement practical
How to track employee leadership growth metrics that reveal real development
Most organizations default to what is easy to count. Attendance logs, quiz scores, and training completion rates are clean data. They are also largely useless for measuring whether anyone actually grew as a leader.
The metrics worth tracking fall into two categories: quantitative indicators that show what changed, and qualitative signals that explain why.
Engagement scores of direct reports
A leader's effectiveness shows up in how their team feels about coming to work. Employee engagement scores measured at the team level, not the organization level, give you a direct read on whether a manager's behavior is improving. Run pulse surveys quarterly and compare scores before and after a development program. A manager whose team engagement measurably improves over several months is applying something.
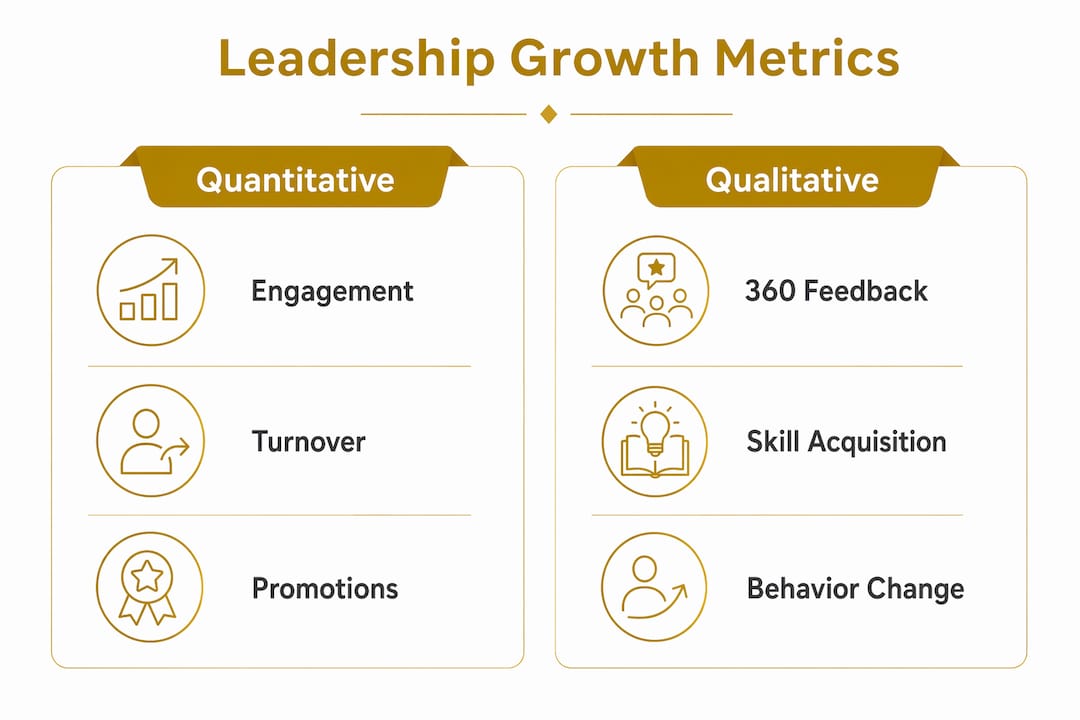
360-degree feedback
This is the most information-dense tool available, and also the easiest to misuse. Balanced feedback sources from peers, direct reports, and supervisors improve measurement reliability far beyond upward-only feedback. The key is running assessments at program start and end, so you have comparable data rather than a one-time snapshot. Without a baseline, a strong 360 score tells you nothing about growth.
Turnover of direct reports
High turnover on a specific manager's team is one of the clearest signals of a leadership problem. Track it at the team level, not just the organizational level. When a development program is working, you should see that number stabilize or decline within 6–12 months. Retention rates of teams led by program participants are a concrete, auditable metric.

Internal mobility and promotion readiness
Track how many employees with active development plans move into new roles, take on expanded scope, or receive promotions within a defined period. The 9-box grid, which rates current performance against future potential, gives HR a structured way to monitor this over time. Tracking grid movement across multiple review cycles shows whether development investments are producing ready-now leaders.

Skill acquisition
Observable change in targeted capabilities, assessed through project output, manager feedback, or a follow-up skills review, is more meaningful than module completion. Define the specific competencies the program targets, then assess them before and after. If a leader was rated "developing" on conflict resolution at program start and "proficient" six months later, that is a trackable data point. Closing the leadership skills gap requires knowing exactly where each leader stands against defined benchmarks.
Pro Tip: Set SMART criteria for every metric you track: Specific, Measurable, Achievable, Relevant, and Timely. A metric like "improve leadership effectiveness" is not trackable. "Increase direct-report engagement scores by 8 points within 90 days of program completion" is.
How the 70-20-10 rule shapes what you measure
The 70-20-10 model allocates leadership growth as 70% from on-the-job experiences, 20% from social learning, and 10% from formal training. Most organizations invert this in practice, spending the majority of their development budget on formal programs while tracking almost nothing outside the classroom.
If you accept the model, your measurement system needs to cover all three segments.
Tracking the 70% (on-the-job experience):
- Stretch assignment completion and documented outcomes
- Manager observations of new behavior applied to real challenges
- Project performance data before and after a leader takes on expanded scope
- Self-reflection logs tied to specific on-the-job challenges
Tracking the 20% (social learning):
- Frequency and quality of coaching conversations, logged by managers
- Peer feedback scores from 360 assessments
- Mentoring relationship milestones (meeting cadence, goal progress)
- Participation in leadership communities of practice or peer learning groups
Tracking the 10% (formal training):
- Pre- and post-assessment scores from structured programs
- Completion rates as a baseline hygiene metric (not a growth metric)
- Knowledge retention checks at 30 and 90 days post-training
The practical implication is that your tracking infrastructure needs to extend beyond your LMS. A leader who completes a formal program but has no stretch assignments and no coaching conversations is getting 10% of the development model, at best. Measuring only that 10% gives you a dangerously incomplete picture. Behavioral science in employee development confirms that real behavior change requires repeated application in context, which is exactly what the 70% captures.
What the Kirkpatrick Model tells you at each evaluation level
The Kirkpatrick Model remains the authoritative evaluation framework for leadership development programs in the U.S., structured around four levels: Reaction, Learning, Behavior, and Results, with an optional fifth level for ROI.
Level 1: Reaction
What did participants think of the program? Post-training surveys capture this. It is the easiest data to collect and the least predictive of actual growth. A leader can rate a workshop highly and change nothing about how they manage. Collect it, but do not let it dominate your evaluation.
- Metrics: satisfaction ratings, perceived relevance scores, net promoter scores for the program
Level 2: Learning
Did participants acquire new knowledge or skills? Pre- and post-assessments, knowledge checks, and competency evaluations belong here. This level tells you whether the content landed, not whether it transferred.
- Metrics: assessment score improvements, competency self-ratings before and after, facilitator observations
Level 3: Behavior
This is where most programs fail to measure, and where the real signal lives. Did participants apply what they learned back on the job? Effective tracking starts with a baseline before the program begins, then uses periodic assessments at 30, 90, and 180 days to evaluate sustained behavior change. A single post-program survey misses the difference between a temporary behavior spike and genuine development.
- Metrics: 360-degree feedback comparing pre- and post-program, manager observations, behavioral incident logs, direct-report survey scores
Level 4: Results
What changed in the business because of this development? Productivity, retention, team performance, and engagement scores all belong here. Isolating the impact of a development program from other organizational variables is genuinely difficult, which is why the U.S. Office of Personnel Management recommends agreeing on performance indicators before the program starts and collecting baseline data upfront.
- Metrics: team retention rates, productivity output, engagement scores, internal promotion rates, quality metrics
Level 5: ROI (optional)
ROI calculations convert Level 4 measures to monetary value and subtract the fully loaded program cost. This is worth pursuing for large-scale programs where executive buy-in depends on financial justification. For smaller programs, the qualitative gains from Levels 3 and 4 often make the case without a dollar figure.
Connecting leadership metrics to business outcomes
Leadership metrics only earn organizational credibility when they connect to outcomes executives care about: productivity, profitability, retention, and succession depth. The challenge is that most of these connections are correlational, not causal, and they take time to materialize.
Success criteria must be aligned with business objectives before a program launches, not after. When HR and senior leadership agree upfront that the program aims to reduce team turnover by 15% over 12 months, the measurement plan writes itself. When that agreement is absent, every post-program metric becomes a debate.
A few practical guidelines:
- Pair quantitative and qualitative data. Best practice combines measurable KPIs with qualitative insights to present a complete picture. Numbers show what changed; qualitative feedback explains the mechanism.
- Watch culture metrics as leading indicators. Team engagement and psychological safety tend to shift faster than structural metrics like retention. Culture improvements within three months of a program often predict retention and performance gains that show up later.
- Avoid attribution overreach. A drop in turnover six months after a leadership program may reflect better management, a compensation adjustment, or a tighter labor market. Acknowledge the confounding variables rather than claiming full credit.
- Track activity metrics as hygiene, not proof. Participation rates and completion percentages confirm the program ran. They do not confirm leadership grew.
Pro Tip: Build your measurement dashboard before the program starts. Agree on three to five specific KPIs with senior stakeholders, collect baseline data, and schedule review points at 90 and 180 days. This structure makes the post-program conversation about data, not opinion.
How Leaderly AI supports continuous leadership development tracking
Traditional tracking approaches rely on periodic surveys and annual reviews. By the time the data surfaces, the development window has often closed. Leaderlyapp takes a different approach, using machine learning and behavioral science to deliver personalized microlessons that adapt continuously to each leader's growth trajectory.
The practical difference shows up in how data is collected. Rather than waiting for a quarterly 360 or an annual performance review, Leaderlyapp captures engagement and progress signals in real time as leaders work through exercises and assessments. HR teams get a running view of development activity and behavioral indicators, not a retrospective snapshot.
Key ways Leaderlyapp supports leadership growth measurement:
- Personalized content adaptation: Machine learning adjusts lesson content based on each user's responses and progress, so the platform is always working on the right competency for that individual.
- Real-time progress tracking: HR and organizational leaders can monitor development activity and skill progression without waiting for a formal review cycle.
- Behavioral science integration: Lessons are grounded in behavioral science principles, which means the platform is designed to drive actual habit formation, not just knowledge transfer. The future of leadership development increasingly depends on this kind of continuous, science-backed reinforcement.
- Scalability: The platform supports organizations of any size, from a single team to an enterprise, without requiring a proportional increase in HR overhead.
- Accessibility: Affordable access means development is not limited to senior leaders or high-potential cohorts. Every employee can build leadership habits, which broadens the pool of data HR can draw on when assessing organizational leadership health.
Where traditional programs generate a data point every few months, Leaderlyapp generates a continuous signal. That density of data makes it far easier to spot a leader who is stalling, identify which competencies are developing fastest, and adjust the program before a review cycle forces the conversation.
What real leadership growth tracking looks like in practice
Two patterns show up consistently in organizations that do this well.
The baseline-first approach: A mid-sized manufacturing company preparing to promote 12 frontline supervisors into management roles ran 360-degree assessments on all 12 before any formal development began. They identified three competency gaps common across the group: giving constructive feedback, managing conflict, and delegating effectively. The development program targeted those three areas specifically. At 90 and 180 days post-program, they ran follow-up 360s and tracked direct-report engagement scores. Ten of the 12 supervisors showed measurable improvement in at least two of the three competencies. Two did not, which triggered targeted coaching rather than a blanket program repeat. The leadership self-assessment data each supervisor completed also surfaced self-awareness gaps that the 360 data alone would have missed.
The culture-metrics-as-leading-indicators approach: A professional services firm tracked team-level engagement scores monthly for managers enrolled in a 12-month development program. Rather than waiting for annual performance reviews, they used monthly pulse data to identify which managers were applying new behaviors and which were not. Managers whose team scores improved in months two and three were far more likely to show retention and productivity gains by month nine. Those whose scores stayed flat received additional coaching at month four, before the development window closed. This approach treats culture metrics not as a final grade but as a real-time feedback loop.
Both examples share a common structure: a defined baseline, specific competency targets, multiple measurement points, and a willingness to act on early signals rather than waiting for year-end data.
How to tailor leadership metrics to different organizational levels
A metric that works for a first-time manager tells you almost nothing about a senior vice president's development. Leadership expectations shift significantly across organizational levels, and your measurement approach needs to reflect that.
Frontline and emerging leaders are developing foundational skills: giving feedback, running effective one-on-ones, managing their own time, and building trust with a small team. Relevant metrics at this level include direct-report engagement scores, 360 feedback focused on communication and approachability, goal completion rates for their team, and skill progression on defined competency frameworks. Internal mobility data matters here too: are these leaders being considered for expanded roles within 12–18 months?
Mid-level managers carry more organizational complexity. They are managing managers, influencing cross-functional work, and translating strategy into team execution. Metrics shift toward team retention rates, cross-functional project outcomes, succession depth within their function, and their own promotion readiness ratings. The 9-box grid becomes particularly useful at this level, since you are assessing both current performance and future potential simultaneously.
Senior leaders and executives are measured primarily on organizational outcomes: business unit performance, culture health across multiple teams, succession pipeline depth, and strategic initiative execution. At this level, cultivating strong leaders internally becomes a measurable leadership outcome in itself. How many ready-now successors does this executive have? How is engagement trending across their entire organization, not just their direct reports?
The principle across all three levels is the same: metrics should reflect the actual leadership behaviors expected at that level, not a generic competency checklist applied uniformly. A first-time manager being evaluated on strategic vision is a measurement mismatch. A senior leader being evaluated only on their own 360 scores is missing the point entirely.
Key Takeaways
Measuring leadership development by tracking behavioral change, culture metrics, and business outcomes, rather than training activity, is the only approach that produces data worth acting on.
| Point | Details |
|---|---|
| Baseline data is non-negotiable | Collect 360 scores and engagement data before any program starts; without it, post-program data proves nothing. |
| Behavior change is the real signal | Measure at 30, 90, and 180 days post-program to distinguish sustained growth from a temporary behavior spike. |
| Culture metrics lead business metrics | Team engagement and psychological safety tend to shift faster than retention or productivity, making them reliable early indicators. |
| Tailor metrics to organizational level | Frontline leaders need competency and engagement metrics; senior leaders need succession depth and organizational culture data. |
| Leaderlyapp enables continuous tracking | Leaderlyapp's machine learning platform captures real-time development signals rather than waiting for periodic review cycles. |
Leaderlyapp makes continuous leadership measurement practical
Most HR teams know what they should measure. The gap is in execution: running 360s twice a year, chasing down pulse survey data, and manually correlating engagement scores with development activity is time-consuming work that often gets deprioritized.
Leaderlyapp closes that gap. The platform delivers personalized microlessons grounded in behavioral science, adapts content to each leader's specific growth needs, and captures progress data continuously rather than in periodic snapshots. HR teams get a real-time view of leadership development across the organization without building a separate measurement infrastructure.
For organizations that want to move beyond tracking participation and start measuring actual leadership growth, Leaderlyapp provides the data density and personalization that traditional programs cannot match. Whether you are developing frontline supervisors or preparing senior leaders for expanded roles, the platform scales to fit the need. Visit Leaderlyapp to see how continuous, AI-driven development can give your organization the leadership metrics that actually matter.