
Measuring behavior change starts with one discipline most programs skip: writing an operational definition of the target behavior that includes a denominator and a time window, and then tracking it at baseline, immediately post-intervention, and again after a delay. Report the result with three numbers, the change in behavior rate (Δ-B), time to first behavior (TTFB), and retention, alongside a documented account of how you checked validity and reliability. Everything else in this guide exists to help you do that well.
TL;DR:
- Accurate measurement requires defining the target behavior with clear action, population, context, and frequency, using validated indicators when possible.
- Combining direct observation, self-report, and proxies through triangulation strengthens the validity and reliability of behavior change data.
- Baseline ABC data collection helps identify behavioral drivers, but logging can influence behavior, so interpret early data with caution.
- Follow-up measurements should include Δ-B, TTFB, and retention over appropriate windows, with effect sizes and cohort details clearly reported.
- A practical measurement plan involves establishing operational definitions, conducting a short baseline, implementing the intervention, and measuring at immediate and delayed follow-ups within a quarter.
Table of Contents
- Define and Operationalize the Target Behavior
- Measurement Approaches: Direct Observation, Self-Report, and Proxies
- Functional Assessment and the ABCs for Baseline Insight
- Study and Evaluation Designs to Estimate Change and Sustainability
- Key Indicators and Metrics to Report
- Data Collection Instruments and Tools
- Choosing Measures: Validity, Reliability, Reactivity, and Bias
- Analyzing and Reporting Behavior-Change Results
- Practical Checklist and Timelines for a Measurement Plan
- Tools and Resources: Frameworks, Templates, and Guides
- Applying Measurement Methods in Leadership Development
- How Leaderly Supports Measuring and Sustaining Behavior Change
- Sources
- FAQ
Define and Operationalize the Target Behavior
Vague behavior definitions produce vague data. "Improve communication" cannot be measured. "Manager sends a written recognition message to a direct report within 48 hours of a completed project" can be, because it names who does what, where, and how often.
A workable template runs like this: population does action in context with a stated frequency or window. Fill in each slot before you touch a spreadsheet or a survey tool. The Think | BIG framework for behavioral outcome indicators recommends starting with existing, vetted indicators whenever one fits your behavior, rather than building a custom metric from scratch every time. Custom indicators take longer to validate and are harder to compare against outside benchmarks.
Two decisions determine whether your numbers mean anything later:
- Denominator: define the eligible, exposed, or enrolled cohort you're measuring against, and write it down before data collection starts, not after you see the results.
- Time window: match the window to the behavior's natural cadence. A daily huddle habit needs a 7 or 14-day window; a quarterly coaching conversation needs a 90-day one.
- Instrumentation: decide whether you're logging a direct event (a login, a completed exercise) or a self-reported approximation, and note which one you're using in every report.
- Proxy justification: if you can't observe the behavior directly (say, "psychological safety" or "delegation confidence"), name the proxy you're using and state, in one sentence, why it's a reasonable stand-in.
That last point matters more than it sounds. A proxy measure without a written justification is a guess wearing a metric's clothing. Document the assumption, even if the documentation is just two sentences in a footnote, so a colleague reviewing your results six months later can judge whether the proxy still holds.
Measurement Approaches: Direct Observation, Self-Report, and Proxies
No single method captures behavior change cleanly, which is why most credible evaluation designs use at least two. Practicing behavior analysts stress that measurement procedures need to fit the specific behavior and context rather than defaulting to whatever tool is easiest to deploy.
Direct observation works best when the behavior is visible, discrete, and occurs often enough to sample. Choose among three sampling rules depending on what you're tracking:
- Frequency sampling counts how many times a behavior occurs in a fixed window, useful for countable actions like interruptions in a meeting or recognition statements given.
- Duration sampling records how long a behavior lasts, better suited to sustained states like active listening or focused work blocks.
- Event sampling captures every instance of a behavior as it happens, which gives the richest data but demands a dedicated observer or automated logging.
Self-report is cheaper and scales further, but it carries real trade-offs. Keep recall windows short (24 to 72 hours performs far better than "in the last month") and use validated item wording instead of writing your own questions from scratch. A five-point behavioral frequency scale with anchored labels ("never," "rarely," "about half the time," "often," "always") produces more reliable answers than an open text box.
Proxy measures stand in for behaviors that are hard to observe directly, like trust or judgment quality. A proxy is only as good as its documented link to the real behavior, so validate it against at least one direct observation before you rely on it at scale.
Triangulation, using two or more of these methods on the same behavior, is the single best defense against any one method's blind spots. If self-reported confidence and observed delegation frequency both move in the same direction, you have a much stronger claim than either measure alone.
Pro Tip: Run a small pilot where you collect both a self-report and a direct observation on the same 15 to 20 people before committing to one method for the full rollout. If the two disagree by a wide margin, that gap tells you something about bias in your instrument, not just noise in your data.
Functional Assessment and the ABCs for Baseline Insight
Before you can measure change, you need to understand what's driving the current behavior. A functional assessment, built on Antecedent, Behavior, Consequence (ABC) charting, is the standard tool for that, and it doubles as your baseline data collection method.
The process works like this during a baseline phase:
- Log every occurrence of the target behavior along with what happened immediately before it (the antecedent) and immediately after (the consequence).
- Look for a pattern across entries. If a behavior consistently follows the same trigger or is consistently reinforced by the same outcome, you've found a lever worth testing.
- Turn that pattern into a testable hypothesis about the mechanism of action, the specific reason the intervention should work, not just a hope that it will.
ABC charts collected during a baseline phase let evaluation teams form and test hypotheses about antecedents, behaviors, and consequences, which is why they sit at the foundation of most rigorous functional assessments. The Science of Behavior Change framework calls this mechanism-of-action work essential: knowing that an intervention worked matters less than knowing why, because the "why" is what transfers to the next program.
One catch: the act of logging a behavior can change it. Self-monitoring is itself a mild intervention, so a baseline measured while someone is actively tracking their own behavior may already show improvement before you've introduced anything else. Build that reactivity into your interpretation rather than treating baseline numbers as untouched.
Pro Tip: If staffing or IRB approval won't support a full formal functional analysis, a two-week ABC diary kept by the participant or a manager still gives you usable signal, just be explicit in your reporting that it's a lighter-weight substitute.

Study and Evaluation Designs to Estimate Change and Sustainability
The design you choose determines what you can honestly claim afterward. A single post-test tells you almost nothing about change; a well-timed sequence of measurements tells you a great deal.
The workhorse design for most behavior-change evaluations is RPPF, randomized pretest, posttest, follow-up. RPPF designs collect measurements at baseline, immediately after the intervention, and again at one or more delayed follow-ups, which lets you separate a short-lived novelty effect from a durable behavior shift. Skipping the delayed follow-up is the most common mistake in program evaluation: a behavior that looks transformed at week two can quietly revert by week twelve, and you'll never know unless you measured it.
Choosing between designs depends on your constraints:
- Randomized controlled trials (RCTs) give you the strongest causal claim, but they require a comparison group and enough participants to detect a meaningful effect, often impractical for a single organization's internal program.
- Quasi-experimental designs (matched comparison groups, staggered rollouts) trade some causal certainty for feasibility when randomization isn't possible or ethical.
- Longitudinal repeated-measures designs track the same cohort over multiple time points and are well suited to slow-forming habits like leadership behaviors that build over months.
- Latent change models handle measurement error explicitly, useful when your instrument itself is noisy (most self-report scales are) and you need to distinguish real change from measurement wobble.
Whichever design you choose, decide your sample size and your success criteria before you collect data, not after. Pre-registering your primary metric and your minimum meaningful effect size protects you from the temptation to reinterpret ambiguous results in a favorable direction once you've already seen them.
Key Indicators and Metrics to Report
Three metrics carry most of the weight in behavior-change reporting, and each one is meaningless without its denominator and time window attached.
Δ-B (change in behavior rate) is the core number: the behavior rate at follow-up minus the behavior rate at baseline, expressed against a stated denominator and window. Behavioral measurement frameworks recommend treating the target behavior itself as the KPI, with Δ-B, TTFB, and retention as the three numbers that make that KPI reportable.
Reporting rule of thumb: never state Δ-B as a bare percentage. Write it as "Δ-B = +18 percentage points among the enrolled cohort (n=142) over a 60-day window" so a reader can judge the claim without chasing you for context.
Time to first behavior (TTFB) tells you how quickly the intervention produces a first instance of the target behavior after exposure. Report it as a cohort distribution, not a single average: median TTFB alongside the 90th percentile (P90) gives a much more honest picture than a mean, which one slow-adopting outlier can distort badly.
Behavior retention measures whether the change holds. Standard checkpoints are D30 and D180, retention at 30 days and 180 days post-intervention, each calculated against a clearly defined cohort (usually "everyone who exhibited the target behavior at least once during the intervention window").
Round out the report with:
- The effect size alongside its confidence interval.
- A plain-language note on practical significance: whether the effect matters to the organization.
- The cohort size at each measurement point, noting any changes between baseline and follow-up.
Data Collection Instruments and Tools
The right instrument depends on how often you need signal and how much respondent fatigue your program can absorb.
Pulse surveys delivered through short SMS or IVR prompts let teams catch shifts in psychosocial mediators (confidence, intent, perceived support) between major measurement points. High-frequency pulse monitoring enables dynamic programming, letting a team adjust an intervention mid-course based on early signals rather than waiting for a final evaluation to discover something didn't work. The trade-off is real: ask too often and response rates collapse. A monthly pulse with three to five questions tends to outperform a weekly pulse with ten.
Observation protocols need a written coding manual before the first observer picks up a clipboard. Spell out exactly what counts as an instance of the behavior, what doesn't, and how disagreements between two observers get resolved.
Event instrumentation, the digital logging built into an app or platform, scales further than manual observation but demands its own discipline:
- Fix event names and field definitions before launch, and treat any later change as a new instrument, not a patch to the old one.
- Version every schema change with a date stamp so you can identify exactly when a metric's meaning shifted.
- Build a rollback plan; if a new tracking release breaks a metric, you need a documented way to fall back to the last known-good version.
Changing instrumentation mid-study without logging it is one of the fastest ways to invalidate a baseline. If your event definitions shift between the pretest and the follow-up, you're no longer measuring the same thing twice.
Manual observation costs more per data point but produces richer, more interpretable detail. Automated event tracking costs more up front to build but scales to thousands of participants at near-zero marginal cost. Most serious programs use manual observation to validate what the automated instrument is actually capturing, then lean on automation for scale.
Choosing Measures: Validity, Reliability, Reactivity, and Bias
A measure that isn't valid or reliable will mislead you no matter how well-designed the rest of your study is. Run these checks before you commit to an instrument.
Validity asks whether the measure captures what you intend it to capture. Check construct validity (does the measure align with the theoretical concept?), criterion validity (does it correlate with an established, trusted measure?), and simple face validity (would a knowledgeable observer agree this measure looks right?).
Reliability asks whether the measure is consistent. For observational data, calculate inter-observer agreement, have two independent raters code the same sessions and compare. For self-report scales, test-retest reliability over a short interval (a week or two, when the underlying behavior shouldn't have genuinely changed) tells you whether the instrument itself is stable.
Reactivity and social desirability bias distort both self-report and observed data. People behave differently when they know they're being watched, and they answer surveys in the direction they think looks good. Minimize both by keeping observation as unobtrusive as reasonably possible and by using validated, neutrally worded survey items rather than leading questions.
Practicing behavior analysts note that measurement procedures need to fit the behavior and setting rather than following a one-size-fits-all rulebook, which is exactly why this checklist asks you to test, not assume.
Pro Tip: Pre-register your success criteria (the exact Δ-B or retention threshold you'll call a win) before you see any follow-up data. It's the single cheapest safeguard against unconsciously moving the goalposts.
Analyzing and Reporting Behavior-Change Results
Every metric you publish needs three companions: the denominator, the time window, and the cohort definition. A Δ-B figure without those three is a number without a home.
Follow a few non-negotiable rules when you write up results:
- State the denominator and window in the same sentence or table cell as the metric, not in a separate methods paragraph a reader might skip.
- Report effect sizes with confidence intervals in every table, not just in the narrative text.
- Flag any instrumentation change that happened between baseline and follow-up, and note how you accounted for it.
- Watch for survivorship bias: if your follow-up cohort only includes people who stayed in the program, your retention numbers are inflated by definition.
- Never mix behaviors under one KPI label. "Engagement" that blends login frequency, quiz completion, and peer feedback given is three different behaviors wearing one name.
A results table works best when every column can genuinely be filled with a real number for every row. Here's the kind of clean summary that structure supports:
A brief methods appendix should list your operational definition, your instrumentation spec (event names or survey items, verbatim), your sampling rule, and your pre-registered success threshold. That's usually one page, and it's the page that lets another team reproduce your work.
Practical Checklist and Timelines for a Measurement Plan
A measurement plan doesn't need to be elaborate to be rigorous. It needs to follow the sequence in order and skip nothing.
- Write the operational definition, denominator, and time window before anything else.
- Run a baseline phase with ABC data collection, typically two to four weeks for simple behaviors, six to eight for complex or infrequent ones.
- Implement the intervention while holding instrumentation constant.
- Measure immediately post-intervention, then again at a delayed follow-up (30 and 180 days are common anchors).
- Analyze with pre-registered thresholds, report Δ-B, TTFB, and retention with denominators attached.
- Document validity and reliability checks in a short methods appendix.
Staffing needs scale with your method: a manual observation protocol for 50 people needs at least one trained coder with time set aside weekly; automated event tracking needs a defined schema up front but far less ongoing labor. Whatever your budget, run one minimum data quality check before you trust any result: confirm your baseline and follow-up cohorts are the same population, measured the same way.
Tools and Resources: Frameworks, Templates, and Guides
A handful of frameworks cover most of what you'll need to build a credible measurement plan without reinventing each piece yourself.
- The Think | BIG behavioral outcome indicator toolkit offers templates for selecting and validating indicators, including guidance on when to build a new one versus adopting an existing standard.
- WSU's functional assessment module walks through ABC chart construction with worked examples suitable for adapting into an observation protocol.
- The Science of Behavior Change framework is the reference point for mechanism-of-action measurement if you need to justify why an intervention should work, not just whether it did.
- Review methodology summaries like the scoping review of behavior change technique evaluation methods before designing a new instrument from scratch; someone has likely already tested a similar one.
Applying Measurement Methods in Leadership Development
Scaling precise measurement across an organization is always a negotiation between rigor and feasibility. A randomized trial with a matched control group is the gold standard, but almost no HR team has the headcount or the patience to run one before the next fiscal quarter starts.
What actually works in practice is a lighter bundle: a tight operational definition, a two-week baseline, an automated event log for the behaviors that can be tracked digitally, and a short pulse survey for the ones that can't. That combination gives you Δ-B and TTFB numbers within a single quarter, which is realistic for most organizations without dedicated evaluation staff.
Leaderly's approach leans on this same logic, mapping microlearning exercises to specific, observable leadership behaviors rather than measuring vague traits. When a habit like structured feedback delivery is built into a microlesson with a clear completion event, the retention metric practically writes itself. That's the practical payoff of good self-regulation design: fewer surprises when it's time to report results.
— Drew
How Leaderly Supports Measuring and Sustaining Behavior Change
Most leadership programs hit a wall the moment they try to prove impact, they have training completion data, but nothing that maps to an actual behavior change. Some platforms close that gap by building measurement into the microlearning itself, so every completed exercise ties back to a specific, trackable behavior rather than a generic satisfaction score.
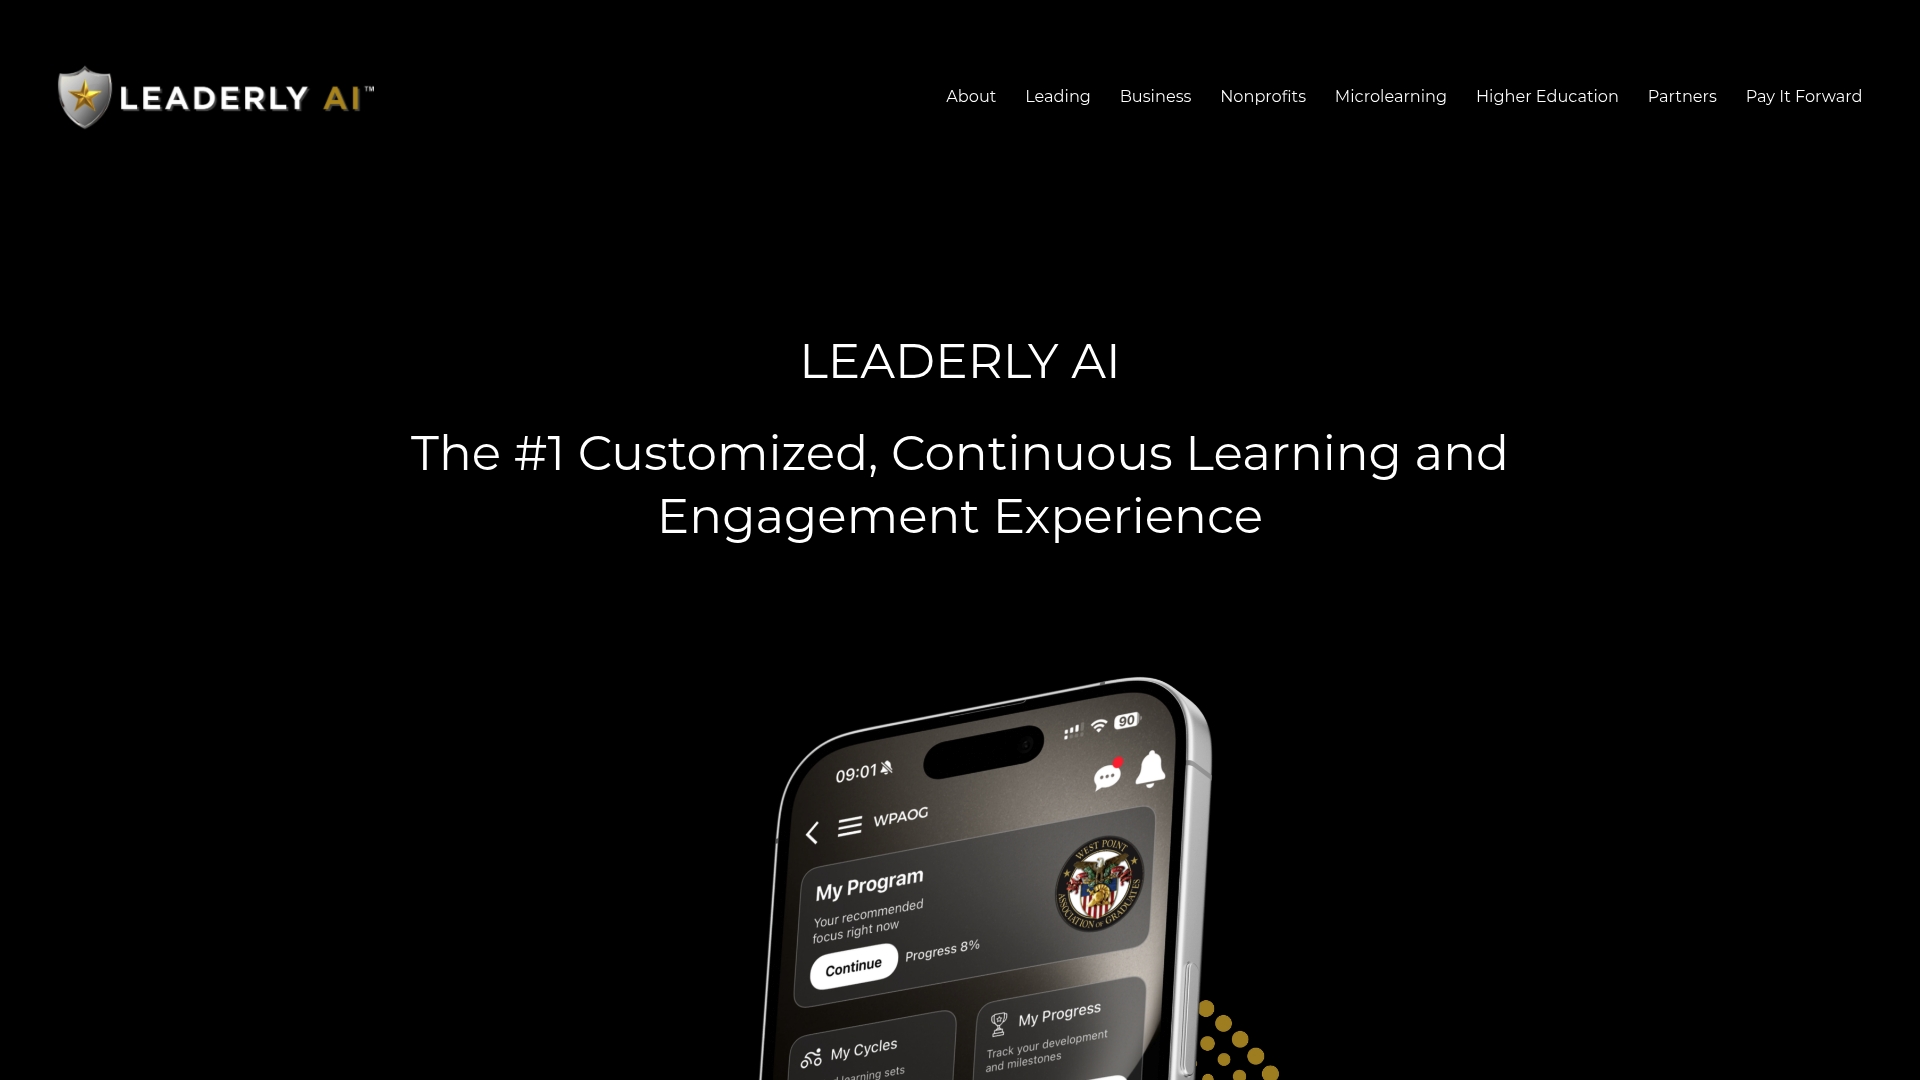
Some platforms offer analytics dashboards that surface cohort-level data mapping directly onto key behavior-change metrics: event tracking for behavior instances, cohort views for retention over time, and growth trends for calculation. They may use machine learning and personalized content adapting to user progress, paired with built-in self-assessments including DiSC, EQ, and MBTI, enabling baseline data collection and ongoing tracking within a single system. Organizations exploring this for their teams can see the full platform at Leaderly AI, and HR leaders ready to scope out an implementation can review enterprise leadership engagement options and request a demo directly from that page.
Sources
For deeper reading beyond this guide, the following sources cover the methods discussed above in more technical detail:
- Module 5: Determining the ABCs of Behavior via a Functional Assessment – Principles of Learning and Behavior (WSU OpenText)
- Randomized pretest–posttest–follow-up (RPPF) study description (Springer)
- Think | BIG: Establish Behavioral Outcome Indicators
FAQ
What Are the 5 A's of Behavior Change?
The 5 A's, Ask, Advise, Assess, Assist, and Arrange, come from clinical behavior-change counseling and offer a structured conversation flow for helping someone move toward a target behavior. They're a counseling framework rather than a measurement method, so pair them with an operational definition and a baseline measure if you need to evaluate whether the conversation actually changed behavior.
Can You Give an Example of a Behavioral Measure?
A concrete example is: "percentage of enrolled managers who deliver at least one specific, written piece of feedback to a direct report within a 14-day window." That statement includes the action, the population, and the time window, which is what separates a real behavioral measure from a vague goal.
What Are the 5 Stages of Behavioral Change?
The commonly cited stages are precontemplation, contemplation, preparation, action, and maintenance, describing a person's readiness to change rather than a measurement protocol. Knowing which stage a cohort sits in can help you choose an appropriate baseline length and follow-up window, since someone in the maintenance stage needs longer-interval retention checks than someone just entering the action stage.
Why Did My Child's Behavior Suddenly Change?
Sudden behavior shifts usually trace back to a change in antecedents or consequences, a new environment, a shift in attention or reinforcement, or an unmet need, which is exactly what an ABC chart is designed to uncover. Logging a few days of antecedent, behavior, and consequence data around the change, the same method used in formal functional assessments, often reveals a pattern that a single conversation won't.
What Does Leaderly Cost for an Organization?
Leaderly does not publish flat pricing; plans are scoped to organization size and needs, so current pricing is available directly on the business page.