
eNPS is a single loyalty-style question that tracks how employee sentiment trends over time; pulse surveys are short, multi-question rounds built to diagnose what's driving that sentiment. If you need a fast, board-friendly trend line, use eNPS. If you need to know why morale moved, run a pulse survey. Most organizations end up needing both.
TL;DR:
- Keep pulse surveys under ten questions, repeat the same anchor question for at least four cycles, and rotate three to eight topic questions.
- Suppress reports for groups smaller than 10, and explain clearly whether responses are anonymous or confidential before each survey opens.
- Pair quarterly eNPS with monthly five to seven question pulses; test changes through weekly checks with two or three questions for four to six weeks.
- Publish findings within two weeks, assign owners before collecting responses, and report what changed before asking employees to complete another round.
Table of Contents
- eNPS vs Pulse Surveys: Comparing the Trade-Offs
- What eNPS Measures and How to Read the Score
- Designing a Pulse Survey That People Actually Answer
- Choosing eNPS, Pulse, or Both
- Keeping Measurement Ethical and Trustworthy
- Turning Scores Into Action: Trending, Segmentation, and Dashboards
- What Comes After the Survey: Templates We've Seen Work
- The Trade-Off Nobody Likes to Admit
- How Leaderly Supports What Comes After the Survey
- FAQ
- Sources
eNPS vs Pulse Surveys: Comparing the Trade-Offs
The two tools solve different problems, and the differences show up most clearly in cadence, depth, and the work required to act on what you learn.
eNPS typically runs quarterly or semi-annually. It asks one question: how likely are you to recommend this organization as a place to work? That single data point is easy to benchmark and easy to present to a leadership team, but it tells you almost nothing about root cause. Pulse surveys run weekly or monthly, usually asking three to ten questions that rotate across topics like workload, recognition, and manager support. The frequency means pulse data goes stale less often, but it also means more administrative overhead: more communication, more analysis cycles, more chances for survey fatigue if you don't manage it carefully.
Anonymity works differently too. eNPS, run infrequently and often anonymously, carries lower stakes per round. Pulse surveys, run often and sometimes tied to unique links for trend tracking at the individual level, require a clearer anonymity or confidentiality policy because employees are being asked more often and the data can be more granular.
eNPS strengths:
- Fast to administer and simple for executives to understand.
- Comparable across quarters and against external benchmarks.
- Low respondent burden, which supports high completion rates.
eNPS weaknesses:
- A single score cannot explain why sentiment moved.
- Easy to over-interpret a small shift as meaningful when it may be noise.
- Without follow-up questions, it offers no path to action.
Pulse survey strengths:
- Rotating modules surface specific, actionable themes (workload, recognition, inclusion).
- Frequent cadence catches problems before they show up in turnover data.
- Open-ended responses give managers language for coaching conversations.
Pulse survey weaknesses:
- Requires more survey design and analysis discipline.
- Can trigger fatigue if cadence outpaces your ability to act.
- Harder to compare cleanly against external benchmarks since questions rotate.
As a decision rule: if you need a single number to track organizational health over time or to report to a board, lean on eNPS. If you need to understand a specific issue, like why a department's engagement dipped last quarter, or to measure the impact of a new manager training program, pulse surveys do that job. If you need both ongoing monitoring and the ability to diagnose problems as they appear, run them together on a layered schedule, which we outline later in this piece.
What eNPS Measures and How to Read the Score
Employee Net Promoter Score borrows its structure from the customer-facing Net Promoter Score. The canonical question asks employees, on a scale of 0 to 10, how likely they are to recommend their employer as a place to work. Scoring follows three steps:
- Sort responses into detractors (scores 0 to 6), passives (scores 7 to 8), and promoters (scores 9 to 10).
- Calculate the percentage of respondents in each group.
- Subtract the detractor percentage from the promoter percentage to get the eNPS, which ranges from negative 100 to positive 100.
A score around 30 generally means a higher proportion of promoters than detractors, indicating positive employee sentiment, though the exact difference varies with context. Whether that's good depends heavily on context: industry, company size, growth stage, and the wording and timing of the survey all shift what counts as healthy. Treat any published benchmark as a reference point, not a verdict, and watch your own trend over multiple cycles rather than reacting to a single number.
The core limitation of eNPS is that it's a single item. It tells you sentiment moved; it doesn't tell you why. That's why most practitioners pair the core question with two or three follow-ups, such as "what's the main reason for your score?" or a rotating prompt about a specific program. Peer-reviewed work on work engagement as a workplace health measure found that engagement correlates with concrete organizational outcomes and even mediates how job resources affect mental health, which supports treating sentiment metrics as more than a vanity number, provided they're paired with enough context to act on.
Statistic callout: Research building an employee-generated sentiment index found that aggregated employee sentiment adds forecasting value beyond traditional sentiment indexes, reinforcing that sentiment data, tracked consistently, carries real predictive signal rather than just being a feel-good metric.
Designing a Pulse Survey That People Actually Answer
A good pulse survey has a short, stable backbone and a rotating front end. The backbone is usually one or two anchor questions you repeat every cycle, often a simplified engagement or satisfaction item, so you can track trend lines. The rotating front end swaps in three to eight questions on a specific theme each round: workload one month, recognition the next, manager support after that, inclusion after that. This keeps total length under ten questions, which protects completion rates.
Administration model matters as much as content. You're choosing between:
- Fully anonymous surveys, which maximize candor but make it harder to follow up with reminders or track individual trends over time.
- Unique-link or confidential surveys, which let you send targeted reminders and track longitudinal patterns, at the cost of employees needing clear reassurance about who sees the data.
- Census administration, surveying everyone every round, versus sample administration, surveying a rotating subset, which reduces fatigue but requires a larger population to get statistically useful subgroup data.
The OPM employee survey playbook lays out exactly this trade-off: anonymous administration protects candor but can allow duplicate responses and blocks targeted follow-up, while confidential administration with unique links supports better data quality if the communication about who sees what is clear.
Open-ended questions deserve a real process, not just a read-through. Tag responses into two or three recurring themes per cycle, track how often each theme appears over time, and feed the most common themes directly into your next rotating module. A pulse program that collects comments nobody reads will erode trust faster than no survey at all. For a practical walkthrough of getting managers to act on early rounds, our piece on fixing your first three pulse surveys covers the common early mistakes in more depth.
Pro Tip: Keep your anchor question identical for at least four consecutive cycles before changing its wording, otherwise you lose the ability to trend it cleanly.

Choosing eNPS, Pulse, or Both
The right choice depends on what decision you're trying to support.
- Use eNPS when you need a trend metric that a leadership team or board can track quarter over quarter without a lot of explanation, or when you want an external benchmark comparison.
- Use pulse surveys when you need manager-level diagnostics, want to test the impact of a specific program change, or need to run a quick experiment on a single team before rolling something out company-wide.
- Run both when your organization needs ongoing monitoring and the ability to explain what's driving the numbers, which describes most mid-size and large organizations once they move past basic headcount reporting.
A common hybrid rhythm looks like this: a quarterly eNPS round for the trend line, paired with a monthly pulse survey of five to seven rotating questions for diagnosis. Organizations piloting a specific change, like a new recognition program or a restructured onboarding process, sometimes add weekly micro-pulses of two or three questions within just the pilot team for four to six weeks, without touching the broader quarterly or monthly cadence. That layered approach gives you a stable macro trend and a fast feedback loop exactly where you need it, without surveying the entire organization every week.
Keeping Measurement Ethical and Trustworthy
The mechanics of anonymity and reporting determine whether people answer honestly, so they deserve more attention than most survey rollouts give them.
Start by deciding, explicitly, whether a survey is anonymous or confidential, and say so in plain language before people start answering. Anonymous means no one, including HR, can trace a response back to a person. Confidential means identifying information exists but access is restricted and results are reported in aggregate. The OPM playbook recommends suppressing reports for any group smaller than 10 respondents, since small group sizes make individual responses identifiable even without names attached. If a team is too small to report on safely, roll its data up to a higher organizational level, delay the report, or combine it with an adjacent team rather than promising anonymity you can't deliver.
Statistic callout: The same OPM guidance notes that fully anonymous administration, while it maximizes candor, can allow duplicate responses and removes the ability to send targeted reminders, a trade-off worth weighing against the confidentiality controls a unique-link system provides.
Census versus sample is a related decision. Smaller organizations generally default to census, surveying everyone, because sample sizes would otherwise be too small to report on reliably. Larger organizations can rotate samples to reduce fatigue, as long as the sample is large enough that subgroup reporting stays above suppression thresholds.
None of this matters if results don't lead anywhere. Before you launch any round:
- Decide who owns each result category before the data comes in, not after.
- Publish a summary, including the parts that aren't flattering, within two weeks of closing the survey.
- Set a concrete review date for follow-up actions, not a vague "we'll look into it."
- Report back on what changed as a direct result of the last round before asking people to fill out another one.
SHRM's guidance on feedback that drives workplace outcomes makes the same point from a different angle: feedback only changes behavior when it's paired with manager action and training, not when it's collected and filed away.
Pro Tip: Draft your communication plan, including what gets shared and when, before you write a single survey question. The sequence matters more than people expect.
Turning Scores Into Action: Trending, Segmentation, and Dashboards
A score by itself is a snapshot. The value comes from what you track alongside it.
Beyond the headline number, track response rate over time (a dropping response rate is often an earlier warning sign than the score itself), subgroup trends by department or tenure, the direction and size of change cycle over cycle, and the recurring themes showing up in open-ended text. A flat eNPS with a falling response rate usually means people have stopped believing anything changes, which is a different problem than a genuinely stable sentiment.
To route findings to the right people:
- Flag any subgroup whose trend diverges meaningfully from the organizational average for a manager-level follow-up conversation.
- Use a short, targeted follow-up survey (two or three questions) to dig into a flagged theme before assuming you know the cause.
- Build manager-level dashboards that show only the metrics that group is accountable for, not the full organizational dataset.
- Keep an internal governance rule that no dashboard view drops below the reporting threshold your anonymity policy requires.
Our breakdown of engagement analytics for HR leaders goes deeper into building dashboards that turn raw scores into prioritized, owner-assigned action items rather than static reports nobody opens twice. For membership-based organizations specifically, Colossus Systems' guide to measuring engagement effectiveness walks through a comparable operational approach for associations and nonprofits tracking member rather than employee sentiment.
What Comes After the Survey: Templates We've Seen Work
Collecting feedback is the easy part. Turning a pulse result into a behavior change is where most programs stall, which is the gap we built our platform to close.
A practical sequence looks like this: run a pulse round, identify the one or two themes that surfaced most strongly (say, manager feedback quality or recognition gaps), then follow up within a week with short, targeted microlessons for the managers or teams most affected, paired with a specific nudge for their next one-on-one.
A simple 90-day structure:
- Days 1 to 30: Run the pulse round, segment results, and assign owners to the top two themes.
- Days 31 to 60: Deliver short, targeted microlearning to the managers tied to each flagged theme, with a specific behavior to practice.
- Days 61 to 90: Re-pulse the same rotating module, compare movement, and report what changed back to the organization.
This is the loop we built Leaderly AI to support: pairing survey data with the kind of small, consistent behavior change that actually shows up in the next round of scores. Our roadmap for enabling managers to capture this kind of momentum walks through the operational detail in more depth.
The Trade-Off Nobody Likes to Admit
Here's the uncomfortable part: there's no version of this that gives you both simplicity and depth for free. A single eNPS question gets your high response rates and a clean trend line precisely because it asks so little of people, which means it will never tell you why a number moved. A rich pulse survey gets you the why, but only if you accept the extra administrative load and the risk of fatigue if you run it too often or too long.
The bigger mistake isn't picking the wrong tool. It's measuring without a plan to act, which research on feedback that drives workplace outcomes consistently flags as the reason engagement programs lose credibility. And never promise anonymity you can't structurally deliver: a small team "anonymous" survey that's actually identifiable the moment results are reported will do more damage to trust than skipping the survey entirely. Say plainly what you can and can't protect, every time.
— Drew
How Leaderly Supports What Comes After the Survey
Running a clean eNPS and pulse program tells you where the problems are. Closing the loop, consistently, across every manager and team, is the part most organizations underinvest in, and it's where we focus.
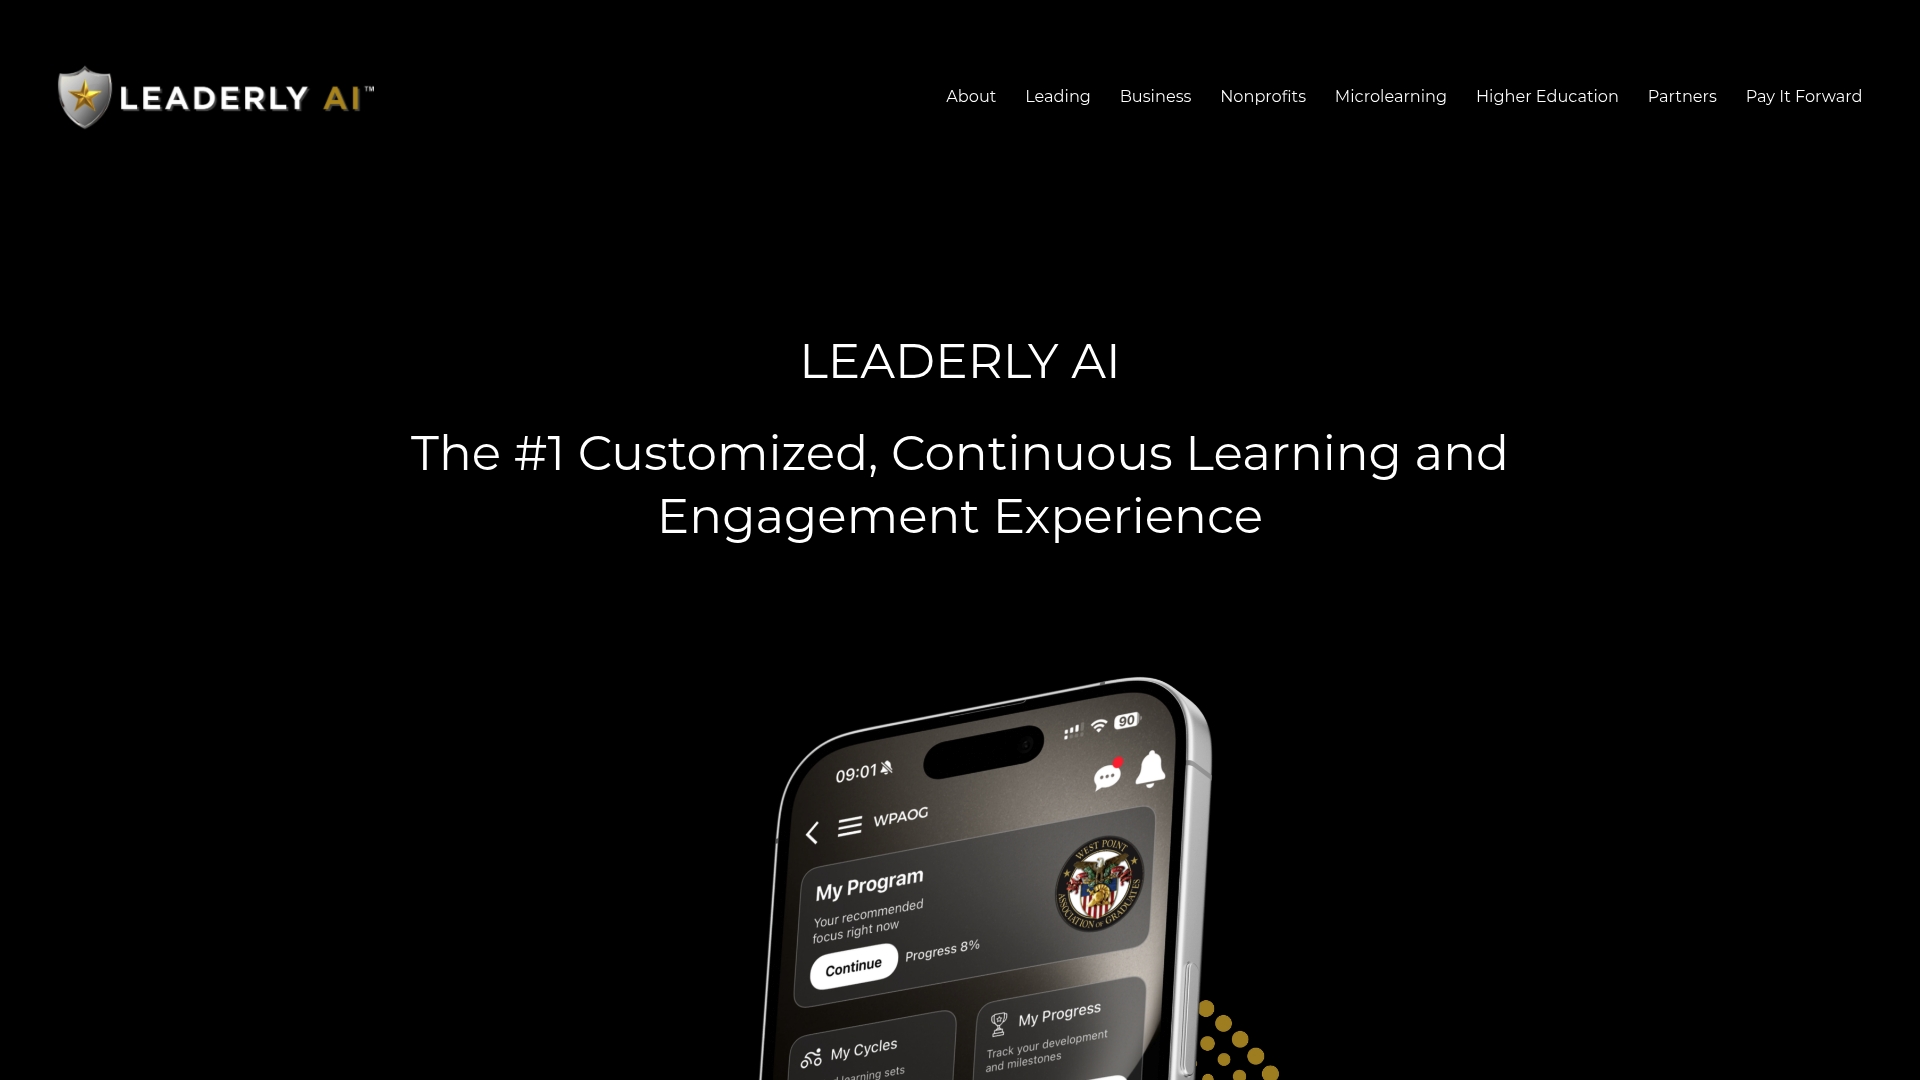
We built a platform to pick up exactly where your survey data leaves off: personalized microlessons tied to the themes your pulse rounds surface, manager nudges timed to land before the next one-on-one, and analytics dashboards that track whether behavior actually shifted between cycles. Rather than asking HR teams to manually translate survey comments into training content, our platform turns a flagged theme, like recognition gaps or manager communication, into a short, specific learning path for the people who need it.
If you're already running pulse surveys, a low-risk way to test this is to pair your next round with a focused microlearning push for just the teams that flagged the lowest scores, then measure movement at the following cycle. Organizations exploring this for their workforce can start with our business platform overview, and nonprofit or higher education teams can look at our dedicated nonprofit or higher education pages for details suited to those environments. Visit Leaderly AI to see how a pilot could fit your next survey cycle.
FAQ
Is a 30 eNPS score considered good?
A score around 30 is generally viewed as solid, but what counts as good depends on your industry, company size, and survey history, so treat benchmarks as a reference point rather than a hard target. Watching your own trend across several cycles matters more than comparing a single score to an outside number.
Are employee pulse surveys really anonymous?
It depends entirely on how the survey is administered: fully anonymous surveys collect no identifying information, while confidential surveys retain some identifying data but restrict who can see it and report results in aggregate. The OPM employee survey playbook recommends suppressing results for groups smaller than 10 people, since small samples can make individual responses identifiable even without names.
What is the best survey tool for employee surveys?
There's no single best tool since the right choice depends on whether you need a simple trend metric, deep diagnostic data, or both, along with your organization's size and reporting needs. What matters more than the tool is pairing whatever you choose with a clear action plan, since feedback that leads nowhere does more harm than no survey at all, according to SHRM's guidance on feedback that drives outcomes.
What is considered a good eNPS score?
A positive eNPS, where promoters outnumber detractors, is typically viewed as healthy, with scores in the 10 to 30 range common among organizations with reasonably engaged workforces. Context matters more than the raw number: track the trend over multiple cycles and compare against your own history before reacting to any single result.
Sources
- Employee Survey Playbook: A Guide for Federal Agencies to Design, Administer, and Report Employee Feedback
- Work engagement: a practical measure for workplace health promotion? | Health Promotion International
- Delivering feedback that drives workplace success — SHRM